Case Study
Constellation is an open-source, serverless, end-to-end framework that aims to simplify geographically distributed load testing. Constellation automates load generation to allow developers to test how their system responds to requests from all over the globe.
1 Load Testing
The term ‘load testing’ refers to the process of placing demands on a system and measuring its response. In the software community, load testing refers to measuring how a software program reacts to multiple simulated concurrent users’ requests.
A ‘load’ in this context is a set of requests made in a specific time period to any program that handles requests, such as a website, web application, or API. The term Application Programming Interface (API) is overloaded but will refer to REST APIs here.
A real-life example of load testing would be Amazon.com making sure servers can handle 3,000,000 customers simultaneously trying to make purchases on Black Friday without errors and having the response time for 95% of users be below 400ms. The page’s load and response times can suffer under a high load, especially if users are located further from the website server and the servers are not optimized to handle such a large volume of requests.
The impact on the performance of the Amazon website cannot be understated. For an online retailer such as Amazon, page speed matters because of its impact on revenue. In 2006, Amazon found that every 100ms delay in page load time cost them 1% of sales. As of 2021, this 1% of lost sales revenue would be approximately $3.8 billion.
1.1 Importance of load test results
Developers are concerned with load testing for the many insights it can provide into the system being tested, such as the maximum possible number of concurrent users, how it affects response time, and the number of failed requests.
A useful load testing tool will allow developers to test their application with different loads and deliver comprehensible metrics such as response times, server response codes, and latency.
1.2 Challenges of implementing load testing
Load testing can be done manually by a single person or multiple people. There are many limitations and challenges associated with manual load testing, but the main difficulty is quickly generating sufficiently large loads. Manually mimicking 3,000,000 users accessing Amazon.com would be prohibitively time-consuming and expensive. A single person or multiple people on their own without test automation tools would not be able to replicate this load by themselves.
To address this challenge we will discuss two approaches to load testing, browser-based and protocol-based.
1.3 The two types of load testing
Let’s discuss what browser-based and protocol-based load testing are, why each approach exists, the problems they solve, and the tradeoffs between them.
Browser-based load testing (BBLT) simulates web traffic with virtual users (VUs) following a script that dictates how to interact with application elements (buttons, forms, etc.) in actual browser instances. This method uses a headless browser, meaning there is a browser instance, but you interact with it programmatically and not via a Graphical User Interface (GUI). Headless browser load testing does not render HTML and CSS, as no one watches the simulated browsers.
The focus for BBLT is to achieve a realistic end-to-end simulation of actual user behavior, flows, or transactions in an application and not only making network requests. An example would be a user logging into Amazon.com and going through the entire checkout process for a purchase transaction.

Protocol-based load testing (PBLT) simulates loads without the use of a browser. The focus is on sending requests to servers using the underlying HTTP network protocol. Performance is then measured on the basis of the request-response behavior. The benefits of this approach are a quick, simple setup and running test scenarios without the need to develop a user interface.
PBLT in comparison to BBLT is less resource-intensive in terms of CPU and memory usage as it avoids the overhead of launching a browser. This means PBLT can generate a greater number of VUs given the same amount of resources. An example of PBLT in action could be a large number of VUs sending HTTP requests to Amazon.com without using a browser and then measuring how the website responds.
The most suitable use case for PBLT is to test back-end components (e.g. API) while BBLT is better suited for testing an application’s user interface with application servers.

We focused on PBLT because it is more resource efficient in generating loads for backend performance testing. In the next section we’ll look at the problem space Constellation operates in.
1.4 Problem Domain
An important point to clarify before continuing is that every application or website that is public has an API. The API can be exposed as a public interface for 3rd parties to interact with application data (e.g. Paypal) or it can be a private API internal to a website's backend that is consumed by the client (browser).
Developers can encounter many challenges in developing APIs. As APIs integrate with more services and get increasingly complex, it can become difficult to determine where performance degradation occurs and what areas to optimize. The location of consumers can also affect API performance. In an ideal situation, two consumers anywhere in the world would experience similar performances.
As an example, some companies such as Paypal offer a public API for 3rd parties to consume. Paypal’s API is available for global users to access their payment services. The appeal of the API is not only in the functionality of processing payments but also in its reliability and request-response speed. This means the API must be highly available for customers worldwide. An outage, service disruption, or performance degradation could result in severe financial and reputational repercussions for the consumer (web application consuming PayPal's API) and Paypal itself. This necessitates the API being performant regardless of geographical location.
Constructing the infrastructure to make that possible is a non-trivial problem. Suppose two API consumers that operate outside of the API provider’s region have significantly different experiences. In that case, developers need to investigate the specific regions experiencing the service differences, update the infrastructure, and check whether the performance gap has improved.
1.5 Geo-Distributed Load Testing
This form of load testing where the load is created from distinct geographic locations is called Geo-distributed load testing (GDLT).
Accurately distributing the load during a load test can improve the reliability of the test in the following ways:
- Realistic Latency: If load testing is performed from further away than your users will be, the test values will be conservative which can lead to unnecessary scaling of infrastructure. Conversely, load testing occurring much closer to the API servers than actual users will result in optimistic, perhaps misleading latency values.
- Workload Model: Geo-distributed load testing represents a more realistic workload because it includes where the load is coming from and how the sources interact. For example, being able to simulate high peak volume traffic originating from the US along with normal AUS traffic in a single test will allow the developer to see if the API response times for consumers in AUS are still acceptable.
- Availability & Load Balancing: Applications built with geographical availability and load balancing mechanisms can route requests based on where those requests originate from. Being able to generate loads from multiple geographical locations can be used to test the comprehensiveness of the routing logic.
2 Existing Solutions
Many open-source load testing applications exist but are challenging to use simultaneously in different geographic regions. That capability is usually in the premium version of the open-source tool in the form of managed deployments. These managed cloud-based solutions include Blazemeter, Artillery, and k6 cloud.
These testing tools simulate users by generating requests (e.g., HTTP(S), AJAX, DNS) using a script. A script is a collection of requests made in a particular order, sometimes simultaneously or with pauses between them, to simulate how a user would consume the API. Test performance measures the response time and inspects the response code but does not make further use of response. The tool returns whether a successful response was received and how long it took to get it. Recall that protocol-based tools do not have a browser or other application to use the responses.
The open-source solutions do not have a built-in way to distribute the load generation geographically - all requests are sent from the server the solution is run from. While a user can manually set up instances of these solutions in different locations, it is a time-consuming, complicated process. Instead, the companies that created the open-source tools provide managed cloud-based SaaS products with this capability.
While developers can easily leverage these tools to perform API load testing, they must consider the service limit tradeoffs. Because these companies manage the deployment and operation of the testing tools worldwide, they impose limits on the number of virtual users, test duration, and data retention (Table 2.1).
| Tool | Geo Distribution | VU Limit | Max Duration | Data Retention |
|---|---|---|---|---|
| Artillery Scale | Yes | 1000 | No Limit | N/A |
| Blazemeter Pro | Yes | 5000 | 2 hours | 6 months |
| k6 Cloud Pro | Yes | 3000 | 1 hour | 3 months |
This restricts load testing to a particular scale and limits the ability to perform soak testing, which checks for issues that only appear after a longer duration. Additionally, the companies storing test data on behalf of the customer will eventually purge that data. While the user can retrieve and store the data, it typically can not be reloaded into the managed service to compare with any new tests.
2.1 Constellation
To address these limitations, we built Constellation. Constellation is an open-source, serverless, end-to-end framework that aims to simplify the challenges of geographically distributed API load testing.
| Tool | Geo Distribution | VU Limit | Max Duration | Data Retention |
|---|---|---|---|---|
| Artillery Scale | Yes | 1000 | No Limit | N/A |
| Blazemeter Pro | Yes | 5000 | 2 hours | 6 months |
| k6 Cloud Pro | Yes | 3000 | 1 hour | 3 months |
| Constellation | Yes | N/A* Tested up to 10,000 | No Limit | 12 months |
The Constellation framework is operated from the command line given a user-generated configuration file and test script. The configuration file contains the number of virtual users (VUs) to follow the test script, the length of time those VUs should repeat the script, and what geographical region(s) those VUs should be located in. The test script would include what endpoints to hit in what order, along with any pauses or other actions necessary to simulate a user’s workflow.
This information is used to deploy several components using AWS services including S3, Timestream, Lambda, and ECS. The components include load generating and data aggregation software to the given remote region(s), as well as database and visualization services to the user's desired home region. Once the test has been completed those remote deployments are torn down, leaving the database and visualizer available until the user removes them.
2.2 How Constellation compares
Let's examine the tradeoffs with using a cloud-based SaaS solution first. As these are managed services, the end user is not responsible for configuring or deploying any infrastructure. Not needing to set up the infrastructure makes the overall process more straightforward. From Table 1 we can see that there is a range of values for virtual user limit, max test duration and data retention. Next we’ll discuss how Constellation compares in these categories.
Virtual User Limit
Load testing an API requires enough virtual users to generate the desired number of requests per minute. Constellation has been tested up to 10,000 VUs.
| Tool | VU Limit |
|---|---|
| Artillery Scale | 1000 |
| k6 Cloud Pro | 3000 |
| Blazemeter Pro | 5000 |
| Constellation | N/A* Tested up to 10,000 |
For the managed services that have a lower virtual user limit (e.g. Artillery, k6 Cloud) they can make more frequent requests to achieve the same number of requests per minute at a cost of higher memory usage. For example, if a load test runs with 3,000 virtual users, and each makes a request every 30 seconds (2 requests per minute), that's 6,000 requests per minute or 100 requests per second. Reducing virtual users to 1,000 while increasing the request interval to every 10 seconds also achieves 6,000 requests per minute.
3000 VUs * 2 requests / minute = 6000 requests / minute
1000 VUs * 6 requests / minute = 6000 requests / minute
Max Duration
Soak testing, as previously mentioned, is continuously load testing a system over a significant period (several hours) to validate system behaviors and uncover bugs and reliability issues. The max test duration affects whether it is possible to perform soak testing. Constellation and Artillery Pro have no limits on the max test duration, while Blazemeter and K6 cloud are limited to 5 hours and 1 hour, respectively.
| Tool | Max Duration |
|---|---|
| k6 Cloud Pro | 1 hour |
| Blazemeter Pro | 2 hours |
| Artillery Scale | No Limit |
| Constellation | No Limit |
Data Retention
The cloud-based SaaS solutions retain data on a rolling subscription basis. Once a subscription ends, however, the data is automatically deleted, or there may be an option to purchase data retention.
Constellation's data retention period is twelve months, AWS's maximum memory store retention period. The tradeoff is that Constellation can keep data for an extended period without paying a monthly subscription. Still, the AWS Timestream database will have monthly fees based on the amount of data stored.
| Tool | Data Retention |
|---|---|
| Artillery Scale Tier | N/A |
| k6 Cloud Pro Tier | 3 months |
| Blazemeter Pro Tier | 6 months |
| Constellation | 12 months |
Constellation Summary
In comparing Constellation with the existing cloud solutions in terms of feature parity, Constellation does not perform WebSocket testing, parallel testing with multiple test scripts, or regression analysis of testing results. The visualizer dashboard displays a limited set of metrics, and scheduled tests are not a built-in feature. Constellation is for developers who do not require the additional features a cloud-based SaaS solution provides. Constellation is a flexible, scalable open-source solution for developers where cloud-based tiered SaaS solutions are too restrictive, excessive, or costly.
Constellation reduces the difficulty of load testing APIs with consumers located in disparate regions. Its purpose is to aid developers in confirming that an API can handle expected workloads at scale before any issues reach production environments. Constellation can simulate loads of up to 10,000 concurrent users and tests can be of any duration. Developers can also see their load test results visualized in a dashboard.
3 Design Decisions
3.1 Virtual Users vs. Requests Per Second
There are two main approaches to API load testing, non-scripted and scripted. Non-scripted testing is relatively simple. The test hits a single endpoint with a specified number of requests in a given timeframe (typically defined using requests per second). The results are relatively straightforward - it shows how performance metrics, such as response times and values, vary given a strictly defined load on an endpoint or a system.
While this can be useful for finding performance issues (e.g. increased response times as the requests per second increase) with a single endpoint it doesn’t simulate real-world use particularly well. APIs rarely consist of single endpoints that operate in a vacuum. One endpoint’s performance could affect the performance of another for various reasons, such as being a direct prerequisite to its use or consuming shared resources while hosted on the same hardware.
Scripted tests, on the other hand, test an API for a defined workflow. A simulated user (known as a virtual user, or VU) performs the scripted operations. For example, it may make requests to log in, fetch user data, send data to be written to a database, and finally log out. Those requests can have pauses in between individual requests or be made simultaneously, whatever most accurately represents how a user will interact with the API. The desired load is then defined by adjusting the number of concurrent VUs (e.g. how does a system perform with 10,000 users performing this set of actions).
Setting up a scripted test is a much more involved endeavor, however. Developing the framework for simulating a user requires significant effort in order to avoid restrictive resource requirements. Simulating 10,000 users should not require 10,000 devices, and the less overhead a virtual user takes, the more can be generated. Additionally, developing the test itself (how many users will perform what actions) necessitates a clear understanding of the API’s use case, it is very easy to perform a test that does not accurately represent how a user will actually consume the API.
Despite the additional complexity, Constellation uses scripted testing. Scripted testing is a significantly more realistic way to test an API as a whole, and this allows Constellation to more accurately simulate users consuming an API simultaneously around the world.
3.2 VU Implementation
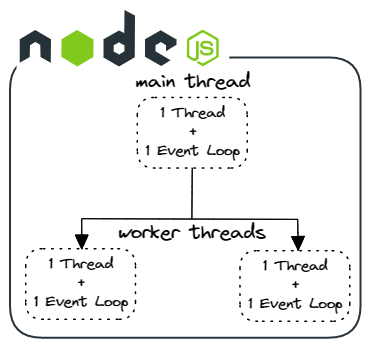
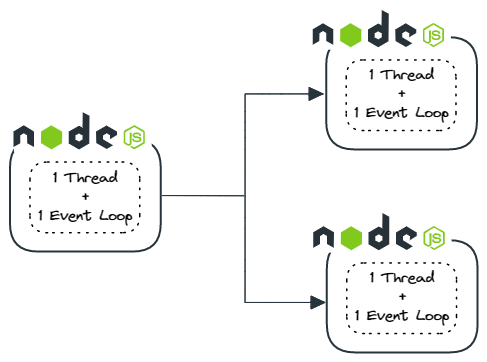
Virtual Users (VU) are the backbone of a scripted load testing approach. A VU must simulate a user as closely as possible while still operating as efficiently as possible. The less resources it takes to simulate a single user, the more VUs can be generated with the same infrastructure. The VUs should also be independent of one another - if one VU encounters an error or has poor performance, it should not impact any of the other VUs. The load generation tool is programmed using JavaScript, and there are several ways to implement VUs in JavaScript, including promises, child processes, and worker threads.
Node.js worker threads enable parallel JavaScript threads within a single Node.js process. We disregarded worker threads early on because they are primarily a way to take advantage of multicore processors to perform CPU intensive tasks asynchronously. Input-output tasks (such as making HTTP requests) are more efficiently handled by the Node.js promise implementation. Also, the number of worker threads typically depends on the number of available CPU cores, but such hardware details are generally not provided by cloud service providers.
Child processes generate independent Node.js processes, which is an excellent simulation of independent VUs. Each VU would operate entirely separately and be independent of any other VU. However, child processes each have their own provisioned memory and depend on the CPU’s process management. This introduces significant performance overhead which would drastically reduce the number of VUs a single load generator could simulate.
Ultimately we decided to use the built-in Node.js promise implementation. Node.js abstracts promise execution into independent threads, allowing for highly performant asynchronous operation of non-CPU dependent processes (HTTP requests, for example). While this does mean that two requests cannot execute at the same time (at least for a given instance of the load generator), they complete within a few CPU cycles of each other, which is sufficient for load testing purposes.
3.3 Results Database
We selected a time series database, which is a database optimized for handling large amounts of time-stamped data, to store the runtime data from the executed test scripts and individual API call data coming out of the data aggregator. It is a write-optimized database type, which in our use case is ideal as database writes are a core part of our application. We are working with data that benefits from a database that can handle a massive amount of write requests and is built around keeping track of data that is time sensitive. Timestream is the AWS offering and fits naturally within Constellation’s overall architecture.
Some trade-offs come with working in a time series database, particularly Timestream. Timestream could only handle one measurement value that was not a string at a time. We could input more than one integer into the database as a string through the dimensions object, which is an object required for formatting data to be inserted into a Timeseries table. However, if we wanted to sort data within a table by one of the columns that were intended to be an integer, the data would be sorted by a string rather than an integer. This forces us to sort by time to see sequential information in regional calls or test tables rather than being able to sort data sequentially by any available column in the table.
Timestream allows for batch write requests, which had one particular benefit that aided both development and our users. Batching write requests reduces the cost of writing data to Timeseries by a rather large margin. The trade-off is that the batch write requests were limited to only 100 records per request. This limitation added development time to the project because extra steps were needed to ensure that the data was sent in 100 record chunks. In addition, these chunks would, at times, be rejected by Timestream's rate limiter and throw a throttling exception without clear instructions on how to avoid the exception. The solution to this problem was to create a recursive function that resends the data until Timestream returns an OK status. This does mean that the amount of data that the data aggregator could handle per second was reduced.
Despite some minor quirks of Timestream, we ultimately chose to use this database because the benefits far outweighed the costs. We needed a database that could handle a large number of write requests that were centered around time-sensitive data and were a part of the AWS ecosystem. Even though there were some small inconveniences they were outshined by Timestream being a fast, cost-effective, AWS integrated solution for our data storage needs.
3.4 Data Collection
Load testing can generate a huge amount of data. Responses can vary from a simple 200 OK to a large content download. Even for small or reduced responses, the sheer number of responses produced can be daunting. For example, a ten-minute test involving 5000 VUs that each make two requests every six seconds produces a million responses.
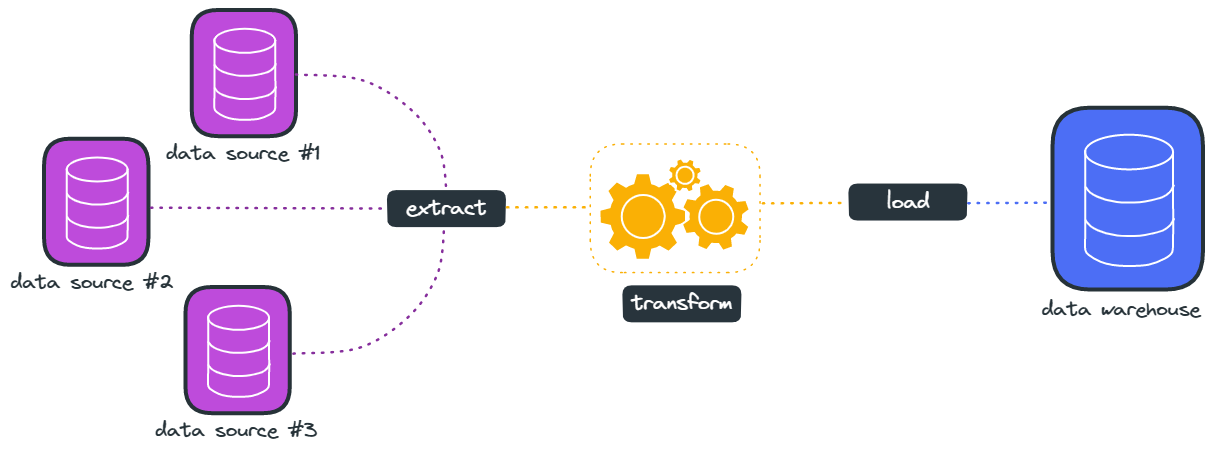
Because load testing tools generate so much data, the tool can be seen conceptually as a large data pipeline. There are two common approaches to managing a data pipeline, ETL and ELT. These acronyms define the order in which three processes, Extract, Transform, and Load, occur.
- Extract: collecting raw data from a data source
- Transform: processing and converting that raw data into a usable form
- Load: putting the transformed data into the target system
The difference between ETL and ELT is when transformation takes place. An ETL pipeline will transform the data prior to loading it into the target. Processing the transformation results in a longer loading process but allows a faster analysis after the data transfer is complete. As a result, the raw data is lost and only the transformed data is stored. If a different transformation is desired later, the raw data will need to be retrieved again.
An ELT pipeline loads the raw data directly into the target, and the target system is responsible for performing any transformation it requires. This allows transformation to be performed as needed on subsets of data rather than on a complete collection of data and allows for different transformations to be performed at any time, but usually increases the total data loaded into the target.
The ELT approach was taken for Constellation’s primary data pipeline that extends from the load generation service to the time series database. The data pipeline process looks something like this: for a given VU running through the test script, a test object containing the measured values from that test (runtime, call response times, etc.) is created. For example, 1 VU running a script that takes 10 seconds for a 60-second test will generate 6 test objects. Those test objects are all collected by the data aggregation service and sent to the time series database. The complete data set is then available for inspection by the user, either using the built-in Constellation visualizer or using other third-party software to query the database.
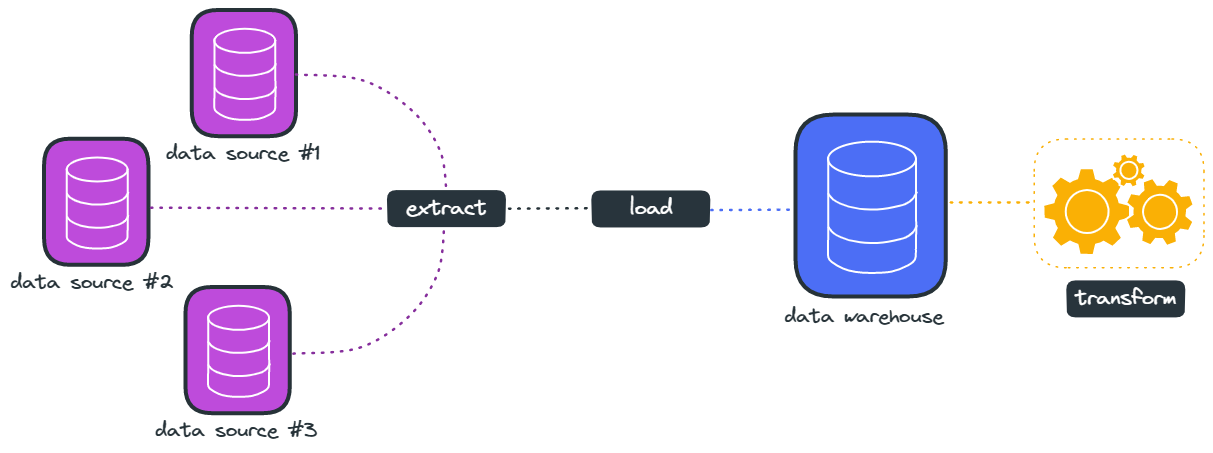
While this results in significantly more data being stored in the database, it allows users to access the data directly and perform any transformations they need on a Constellation test’s results, in real-time, without any loss of data to abstraction or any processing delay due to a generic transformation process.
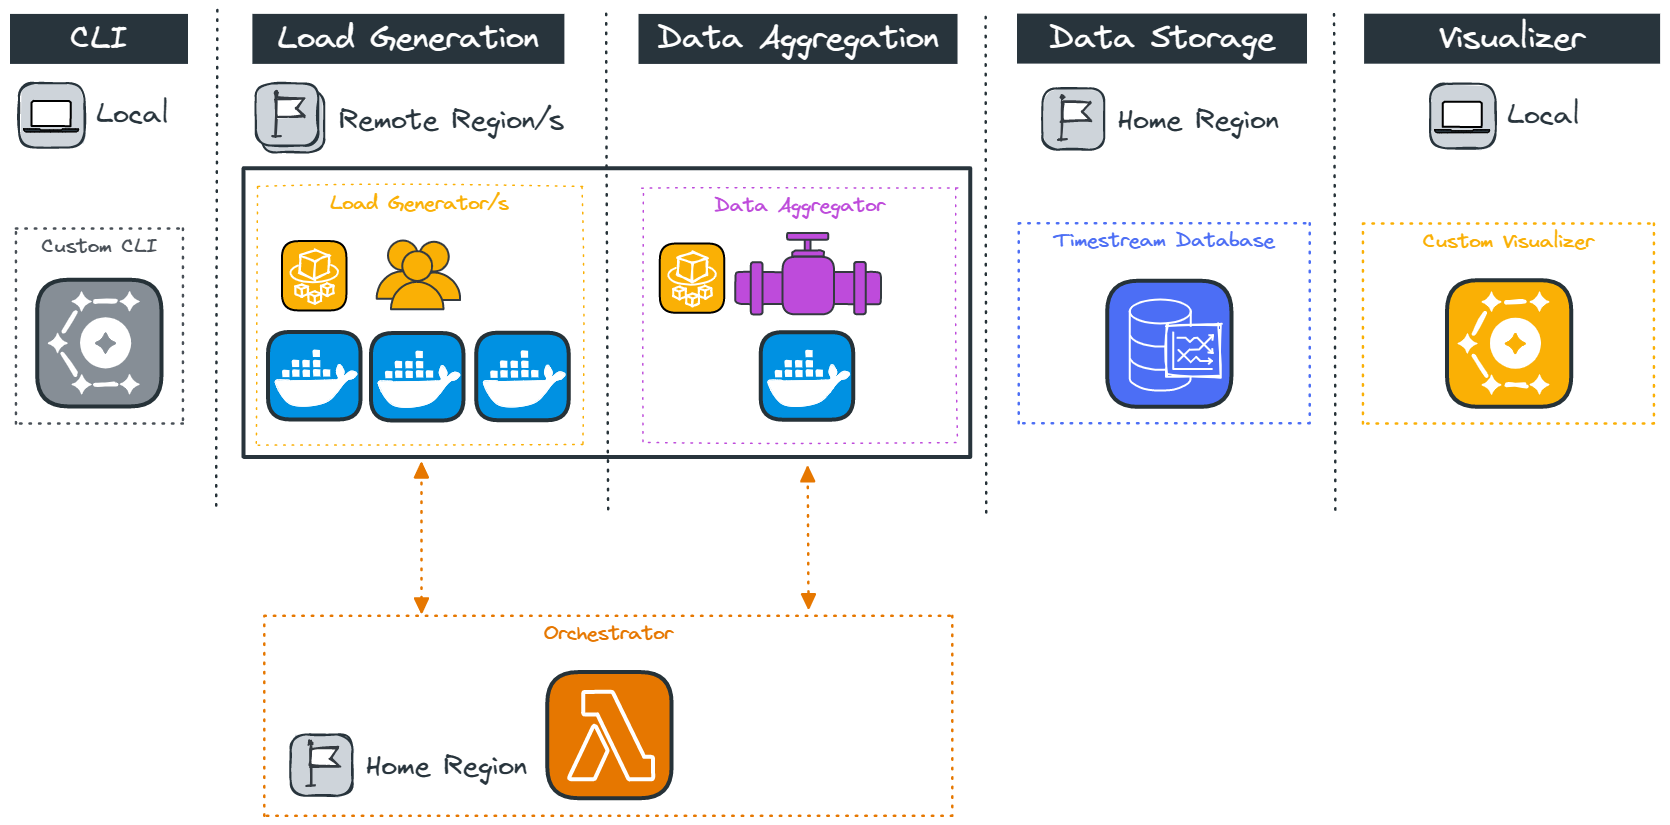
4 Constellation’s Architecture
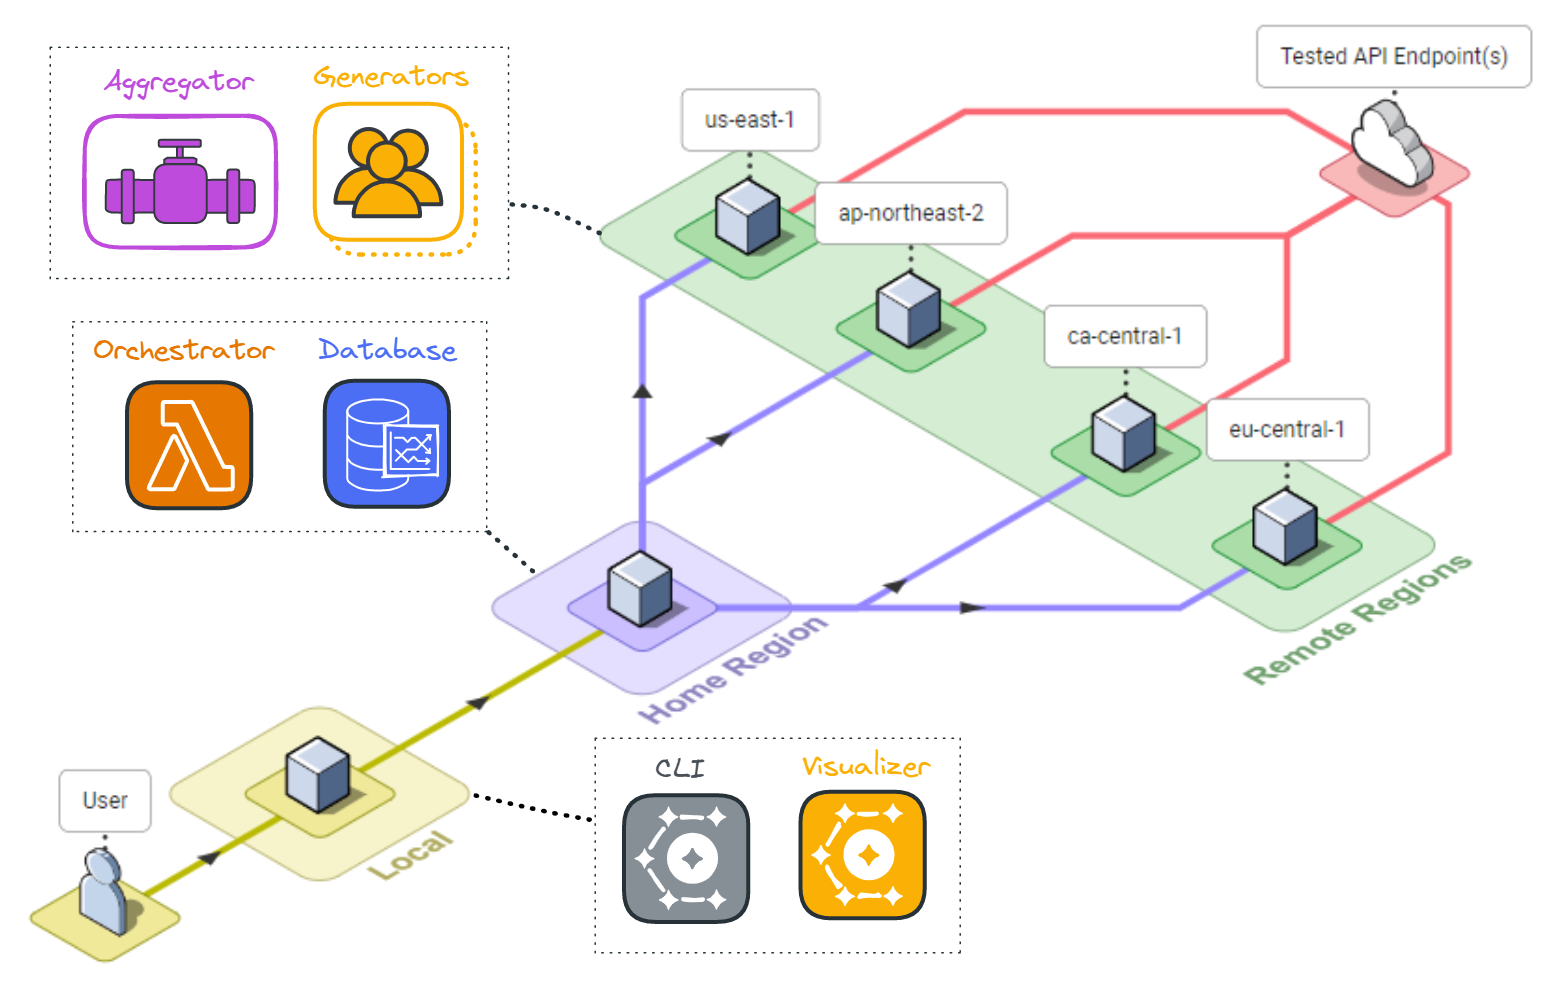
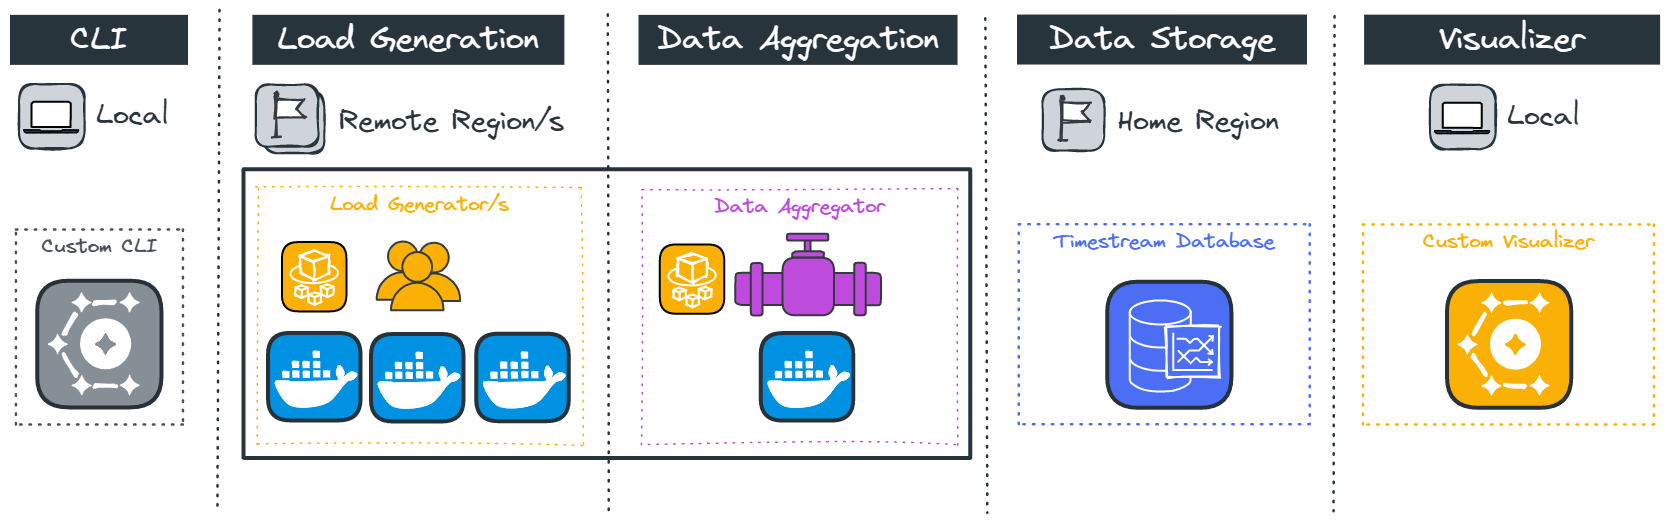
The Constellation system architecture consists of several components deployed across the user’s local system and the cloud. The primary goal of Constellation is to generate load from globally distinct locations, so a global cloud computing service such as AWS is an ideal fit for deploying Constellation. Because the system varies by location the components and their responsibilities will be introduced by location, the user’s local system, a “home” region, and several “remote” regions.
An npm package containing the deployment and visualization functionality is installed locally. The Constellation cloud architecture includes a “home” region and some number of “remote” regions. The home region is used to orchestrate the test and store the test results, while the load is applied from the remote regions.
Specifically, several data stores, including a file storage system, a key-value database, and a time series database, are deployed to the home region along with orchestration functions. Remote regions are deployed with load generation containers and a data aggregation container.
4.1 Local

The local system is used to deploy the Constellation cloud architecture and host a test result visualizer. Using Constellation requires the installation of the npm package on the user’s local system. The package includes commands for the set-up and tear-down of resources in the home and remote regions and a locally deployed visualization tool that accesses the test results in a time series database.
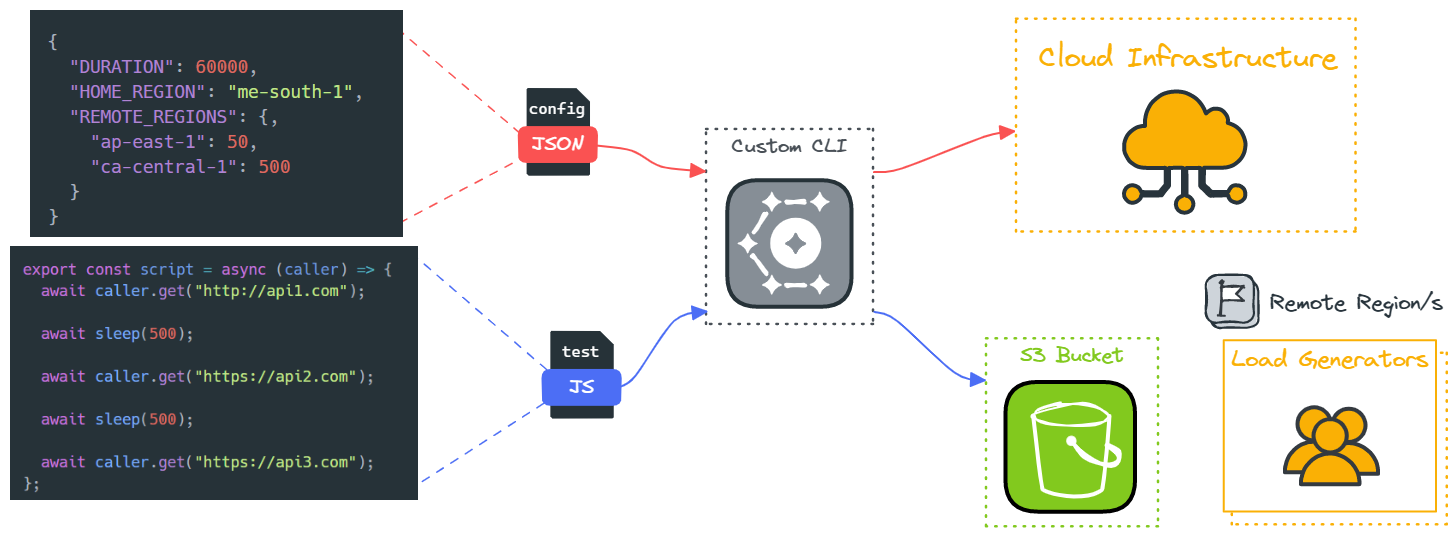
The set-up and tear-down commands depend on two user-generated files, a JSON file that defines the test configuration and a JavaScript file that defines the script a VU should follow when testing. The AWS CLI and CDK must also be installed, including the set-up of a local AWS profile. The AWS CDK pulls account metadata from the default AWS profile and then deploys the testing infrastructure.
4.2 Home Region

Once Constellation is installed on the local system, it can be used to deploy resources in the home region to orchestrate testing and store the test results. The home region (defined in the config.JSON) hosts the file storage, key-value database, time series database, and AWS orchestration lambdas.
The file storage service uses AWS S3 for simple, region-agnostic, role-based file access to hold the JavaScript test script and make it available to the remote load generation containers.
A key-value database orchestrates the timing of tests and stores arrays of remote regions at various stages of deployment. Once every remote region is ready to begin testing, Constellation generates a test start timestamp and stores it for the load generation containers. The orchestration uses Amazon DynamoDB to integrate with the other AWS services.
Remote regions communicate with the orchestration database through AWS Lambda functions. The remote architecture invokes the lambda to synchronize testing by modifying and retrieving test status booleans and timestamps from the key-value database.
A time series database stores the results from the load tests. These results include the latency of individual API requests and the duration of individual runs through the script. They can be queried to find the average latency or success of a particular type of call, the average runtime of the script, the ratio of successes to failures, and more.
4.3 Remote Regions

The remote regions are the source of load during testing. Each remote region hosts some number of load-generation containers (depending on the desired number of VUs) and a single data aggregation container. These containers depend on several settings defined in the configuration and test script files.
Docker containers standardize the code execution environment and are deployed using the AWS Elastic Container Service (ECS). This serverless deployment significantly eases deployment and reduces unused system resources.
The number of load generators deployed in a region depends upon the total number of VUs desired in that region. Because a container deployment is only guaranteed a limited amount of memory and CPU resources, each load generator is limited to 200 VUs to provide processing overhead for the test script. Still, the amount of processing beyond making HTTP requests should be limited when writing the script in order to prevent blocked requests. For example, an API that uses the response from one call to make another should have that call explicitly defined in the test script, not calculated from the first call’s response.
The data aggregator sends the results from all the generators in batches and provides a single data stream to the time series database in the home region.
5 Components
5.1 CLI
The user interacts with the Constellation framework via the CLI. Once the user has created the configuration file and the test script, the user can then initialize infrastructure and execute the test accordingly. More specifically, the configuration file is used to determine the number of VUs and the number of regions the infrastructure needs to accommodate, and the test script, containing details of the user behavior to simulate, is uploaded to an S3 bucket to be later used by the load generators.
The CLI also provides a command to access the custom visualizer to view the test results, in addition to a command to teardown any cloud infrastructure used to set up the test.
5.1.2 Streamlining Deployment with AWS CDK
The primary goal of the CLI is to ensure that all components of the framework are deployed with minimal user input. Given that a large portion of our infrastructure is user configurable (ie: home region, remote regions, and variable container number per region), the primary challenge is how to streamline deployment with numerous user-configurable parts.
Our first choice was using AWS Cloud Formation - this service uses YAML files containing configuration details for the various infrastructure components. A single AWS CLI command can then be leveraged to deploy the required infrastructure. However, Cloud Formation is ideal for deployments with a configuration that generally stays consistent from one user to another. As our framework requires an infrastructure heavily configured by the user, incorporating business logic to create YAML files according to user configuration would have presented a significant challenge.
As such, the Constellation framework leverages the AWS Cloud Development Kit (CDK). This is essentially infrastructure-as-code which is an abstraction of Cloud Formation. A YAML file is still synthesized from the CDK, however business logic can be more readily integrated.
In our framework, the business logic inspects the user-generated configuration file to determine the location of the home region, remote regions & corresponding number of VUs for each region for the CDK to gather as inputs. From this, the CDK synthesizes the required Cloud Formation YAML files, which are then used by AWS directly for deployment.
5.2 Load Generation
As a load-testing framework, Constellation needs to simulate VUs that repeatedly execute the user-defined script, generating requests and passing the resulting metrics to the data aggregation container.
Initially, a load generator updates the orchestrator database with its deployment status and retrieves the test script. This process then polls the orchestration lambda for a start time that the tests will use for execution in an effort to synchronize testing across regions.
During test execution, Constellation creates VUs and repeatedly runs the test script. Each test script run generates a JavaScript test record object that contains the start time and runtime for the script, as well as the start time, latency, and other defining characteristics of the HTTP calls made during that run, as defined below:
These test record objects are sent to the data aggregator in batches every 10 seconds. Once the test duration ends, Constellation sends a final batch of tests to the data aggregator and a post-processing function sends a signal indicating that the load generator container is ready for teardown.
5.3 Data Aggregation
The data aggregation code acts as a funnel to consolidate completed test results from the load generators in the same region and pass them into an AWS Timestream database in the home region.
Each regional load generator sends its completed test results in 10-second intervals to the aggregator where they are saved in a SQLite database that acts as a temporary data store. The aggregator has a single route that is responsible for parsing and formatting the incoming data from the load generators and saving the data to the SQLite cache.
The aggregator then writes the data from short-term storage to the Timestream database in 10-second intervals. It sends data utilizing Timestream’s ability to handle batch write requests of 100 records per write and handles AWS throttling exceptions to achieve more efficient write speeds. At the end of the test, the aggregator continues attempting to send data to Timestream until five 10-second intervals have passed in which it has received no data from any of the load generators. This marks the end of the load testing and halts the recurring interval in preparation for teardown.
5.4 Data Storage
Initially, we tried an ETL approach, storing data within Timestream with only one table, with each row holding a JSON object. This object represented the aggregates of all tests and API calls sent by each regional data aggregator - we collected the averages of the test runtimes and call latencies and discarded the rest of the data. The only purpose of this approach was to visualize the data in a front-end application. However, this approach potentially loses valuable data while writing to Timestream, discarding potentially valuable data and not allowing users to make useful queries in the Timestream database.
Our final approach to data storage was an ELT solution that gave the user more freedom by providing granular data within the Timestream database. We created two tables for each region, one for the completed test scripts and one for the API calls made in each test script. This also allowed us to use a single database that contains data from all of the regions instead of creating a separate database for each region.
This allows users more flexibility in interpreting the data by allowing for database queries. For example, a user could query the calls tables for failed requests within a certain time frame, or query a region's test table to get all tests with runtimes that exceed a certain time limit. Both of these would have been impossible with our initial ETL approach that discarded data in favor of simple averages.
5.5 Visualizer
We created the visualizer to provide a functional visual representation of the data that was output by Constellation’s tests. Its function is to allow the user to see test results by region. Each region has two different graphs: the first allows the user to view the average runtime of the tests, aggregating by either a 1, 5, or 10-second interval. The second is a bar graph that visualizes successful calls from the test script compared to how many calls failed according to the method and URL tested.
These two metrics were picked because latency and the number of successful calls vs. calls resulting in errors affect user retention. These metrics benefit the most by having graphical representations of latency spikes and call success-to-failure ratios.
We built our visualizer with the chart.js library because of our familiarity with the program, its ease of use, and its integration with React. We decided that having the option to batch-test runtime data with a drop-down menu based on the interval the user chooses would help declutter the data. Some tests will be much longer than others, and an interval of one second could make the data visualization difficult to parse. Making a 10-second interval allows for more flexibility and helps declutter the data being viewed.
6 Challenges
6.1 Test Synchronization
A challenge in deploying a distributed system is that there is no guarantee each system will deploy at the same time (refer to image below). The issue, then, is how to synchronize the system components for simultaneous testing.
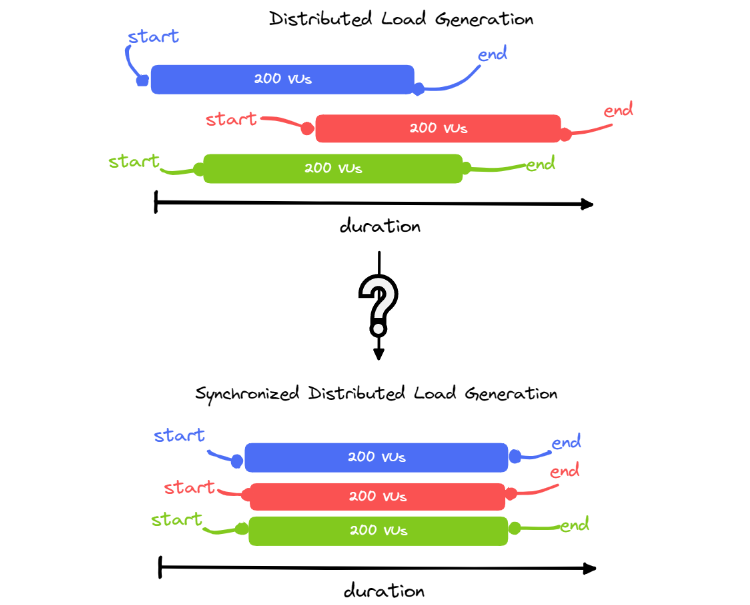
As can be seen in the diagram above, if multiple components generate all the required VUs, they will start at different times which will stagger load generation. This compromises the accuracy of the results because the targeted API will not experience all 600VUs at the same time.
Furthermore, our architecture demands the existence of an additional component - the data aggregator - in our remote regions. As highlighted in a previous section (6.3 Data Aggregation), this component receives data from that region’s load generators for batching to be sent to the Timestream database. This presents a problem where we need to somehow guarantee that an aggregator is “listening” before any load generators send data to it - otherwise data will be missed or dropped.
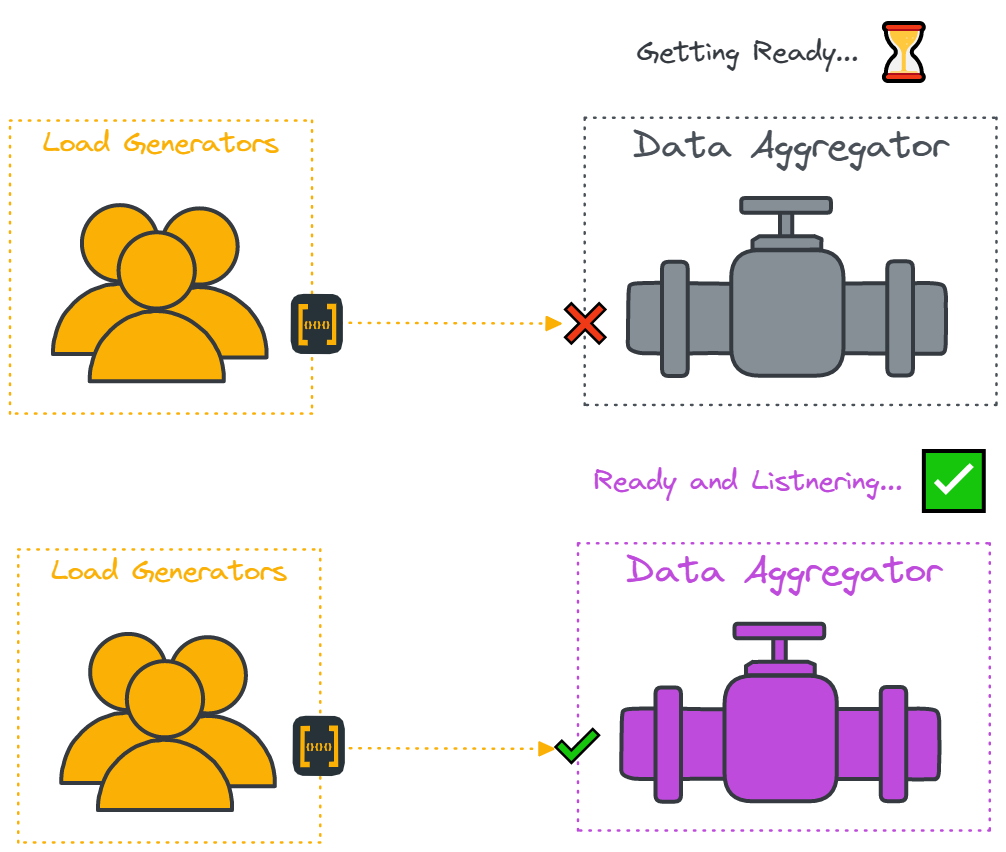
In summary, there are two prerequisites in order to achieve test synchronization:
- Load generators need to have a “ready” data-aggregating component prepared to receive data.
- All load generators start sending API requests at the same time, independent of geographical location and number of load generators.
6.1.1 Solution Overview
To solve this problem, we introduce additional components to our architecture. These involve:
- A central orchestrator which interfaces with the load generator and data aggregator.
- A blocking process that prevents the load generator from executing its core responsibility of making API calls and simulating VUs.
To illustrate how this works, we will demonstrate orchestration in three scenarios of increasing complexity:
- Single remote region with a single load generating component
- Single remote region with multiple load generating components
- Multiple remote regions with load generating components

6.1.2 Scenario: Single remote region with a single load generating component
With this scenario, there is one load generator to one data aggregator. To achieve test synchronization, the data aggregator needs to be ready to receive data before the load generator sends it any - to ensure no data loss.
To achieve this, the load generating component has a blocking process that continually polls the orchestrator. The blocking process either receives “true” or “false”. If it receives “false”, it is prevented from simulating VUs and polling continues. The only condition to which “true” is received by the blocking process is when the data aggregator has sent a ready signal to the orchestrator that it is finally ready to listen for data. When “true” is received by the blocking process, the blocking process is halted and VU simulation is allowed to occur.
As can be seen in the diagram below, even if load generation is ready before the data aggregator, this solution has the effect of guaranteeing that no load generator sends data without a data aggregator ready to receive it.
6.1.3 Scenario: Single remote region with multiple load generating components
With this scenario, there are now multiple load generators to one data aggregator.

While the previous solution works for a single load generator, it is now insufficient as it does not guarantee multiple load generators are simulating VUs at the same time.
To accommodate this, we expanded on the previous solution. Any load generators ready before the data aggregator still receives a “false” signal from the orchestrator. This signal changes to a timestamp shortly after the orchestrator receives a ready signal from the data aggregator. This timestamp (aka time-to-execute - TTE) informs the load generators when to simulate the VUs by marking the specific time to which the blocking process is halted.
Since the same TTE is received by all load generators, they all halt their blocking processes at the same time and therefore simulate VUs at the same time.
The orchestrator calculates the TTE determining the time in which it received the ready signal from the data aggregator and adding a buffer to it. This buffer has been determined to be 50 seconds. To see how the value was derived, see section 8.3.5.
6.1.4 Scenario: Multiple remote regions with Multiple load generating components
With this scenario both load generation and data aggregation are distributed geographically, which is more reflective of the geo-distributed API load testing that the Constellation framework facilitates.

To test synchronization in this scenario, the prerequisites are as follows:
- A load generator cannot execute unless a local data aggregator is confirmed to be listening
- All load generators must execute at the same time - regardless of region.
To accommodate this, we modify the previous solution by changing how the TTE is calculated. As the data aggregators from multiple regions eventually become ready, they send their respective ready signals to the orchestrator. From the perspective of the orchestrator, it is initialized with information about which regions are involved in the test. As such, the orchestrator knows to expect which regions to receive ready signals from. Once it has received ready signals from all the expected regions, it calculates the TTE with the buffer time which is then sent to any polling load generator.
Since all load generators receive the same TTE, all blocking processes are halted at the same time. At a high level, it guarantees synchronicity between locally and geographically distributed load generators while also guaranteeing that data aggregators are readily available to receive data prior to the execution of any tests. Thus, this ensures the accuracy of test results through synchronicity and guarantees no data loss.
6.1.5 Solution caveat
The caveat of this solution is that it does not guarantee that all load generators are provisioned prior to the TTE. If such a thing were to happen, they will receive a TTE indicating a point in time already passed. Due to the non-deterministic nature of cloud deployment, this could happen. But, the solution relies on an assumption that distributed components of the same region tend to be provisioned around the same time as each other. In practice, the components are provisioned within a few seconds of each other. Our framework applies a 50s buffer time which should give ample time for all load generators to be provisioned prior to TTE.
6.2 Data Aggregator cache control
As highlighted in section 6.3, the design of the data aggregator consists of a receiver and a reader process with a SQLite database as a cache.
SQLite ultimately simplifies our design as it is a self-contained database that does not require a separate server to run. For our use case, this means that we did not need to add an additional component like DynamoDB. The tradeoff is that this is a monolithic solution. This means that the receiver, reader, and database all share the same resources. The problem arises when the data aggregator receives too much data and the cache becomes bloated. Reads and writes to the cache become progressively slower as they have to process more rows, especially during large tests. These slower operations adversely affect the adjacent processes causing them to slow down and even reject incoming data. As such, the size of the cache must be controlled.
Our first cache control solution involved reading all the contents of the cache and then deleting all its contents. But because reading and deleting are two separate operations, there is a small period in time between them. We found that in this small period of time, some data may be written to the cache. If this happens, this data is written but never read. As such, this solution results in valid data being deleted before having been batched for Timestream.
To solve this problem, our cache control involved delayed reading and deletion. This involves a series of queries to the cache which is executed every 10s as per periodic batching of the reader process. An overview of the cache control logic is as follows:
- Any data older than 10s are read
- Then, any data older than 20s is deleted
This has the effect of leaving written data in the cache for 10s until it is read, and 20s until it is deleted. Separating read, writes, and deletion by age of data in the cache prevents accidental deletion of unread data. Furthermore, because we are pruning the cache by deleting data older than 20s, the cache size is controlled.
The caveat to this solution is that if the data aggregator interfaces with more than 130 load generators with 200 VUs each, the cache operations noticeably slow down. The reason for this is that we do not delete data which are younger than 20s. If the volume of data written to the cache in this period in time is large enough, the number of rows in the database cache starts to affect the reads and writes again and adversely affect the adjacent processes once again. As such, this proved to be the design limit for the number of VUs in a region. We have limited the possible number of load generators in a region to 100 to account for a 30% safety margin.
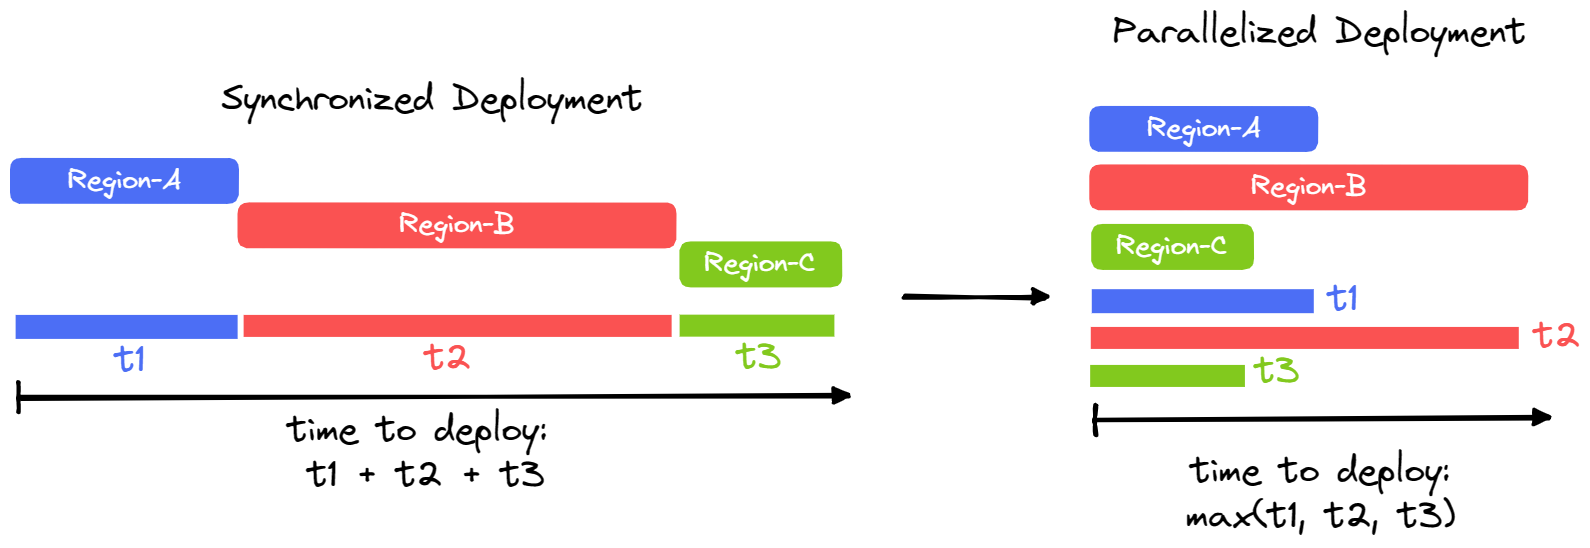
6.3 Minimizing Deployment Time
As the framework allows for regional deployment in up to 23 regions at a time, it is crucial that deployment & teardown times are minimized to maintain usability. Since a remote region deployment takes around 5 minutes, synchronous deployment to all the available regions would take around 2 hours. This is well outside the bounds of a useful tool.
To solve this problem, the framework implements parallel deployment. While the CDK deploys synchronously by default, the framework isolates each remote region deployment and wraps them as Node.js child-processes. This then allows us to set up as many child-processes as there are remote regions which are then executed in parallel.
As a result, the deployment to 23 regions will only take as long as the slowest region - around 5 minutes instead of 2 hours - a 95% reduction.
7 Conclusion & Future Work
Constellation provides an accessible and configurable framework for performing geo-distributed load testing. A flexible infrastructure is deployed to perform testing and store resulting data from the command line using a CLI, which can also be used to launch a built-in data visualizer locally.
Software is never done, and we have several ideas for improving and expanding Constellation:
- Currently all of the data from a running test is stored in the results database. Not all of this data is necessarily useful, and the degree of usefulness is dependent on how the user plans to use Constellation. There are many ways data reduction can be performed, from simply discarding test results to performing complex data normalization processing, which could be configured by the user.
- Both the load generator and data aggregator would benefit from being implemented in a more efficient language such as GoLang to improve performance, increasing the number of VUs a single instance can operate and their concurrency capability.
- The CDK implementation should be evaluated for unnecessary operations and leftover deployment artifacts as well as fine-tuning CPU and memory allocations for the containers. The CDK may eventually be replaced with a custom deployment application using the AWS SDK to improve deployment times.
- Several pieces of supporting software can simplify Constellation’s use and verify that tests will perform as intended. These tools include the capability to deploy the load generator and data aggregator locally, inspect the correctness of the configuration and test script files, and check the local AWS account to verify that the system is prepared to deploy using the CDK.
8 References
- k6 documentation
- Private Load Zones
- Soak Testing
- What are API's
- Retention Properties
- Amazon Speed Study
- Geeking With Greg
- The State of Online Retail Preformance
- Protocol Based Load Testing
- single-thread vs child-process vs worker threads
Presentation
Team